

|
|
|
|
June 29, 2008
There really is a hockey stick!
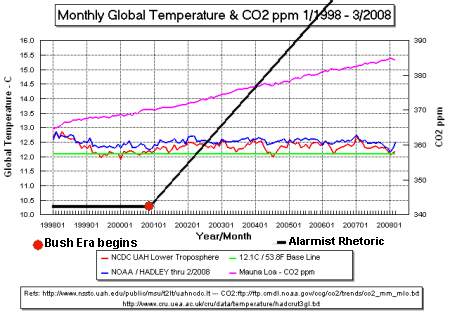
(And it's very alarming) I keep hearing and reading that the average world temperatures reached their peak in 1998, and leveled off since. This article -- titled "There IS a problem with global warming... it stopped in 1998" is typical: For many years now, human-caused climate change has been viewed as a large and urgent problem. In truth, however, the biggest part of the problem is neither environmental nor scientific, but a self-created political fiasco. Consider the simple fact, drawn from the official temperature records of the Climate Research Unit at the University of East Anglia, that for the years 1998-2005 global average temperature did not increase (there was actually a slight decrease, though not at a rate that differs significantly from zero).Why wasn't there a much huger volume of hysteria back in 1998, when temperatures were supposedly at their peak, than there is now? Other than the fact that Bill Clinton was president then, and George Bush is president now, I am at a loss to explain this phenomenon. Anyway, look at the graph:
(CO2 is in pink, while temperatures are in red and blue.) You can click on the above to see a larger version, and the URLs given are the following: So why is it that every time I read about Global Warming, it is taken as a given that increased CO2 levels correlate with higher temperatures? The only correlation I can see is a political one. So, if we superimpose a line representing global warming alarmist rhetoric (measured in parts per million, naturally) over the same period, that proverbial "hockey stick" we so often hear about immediately becomes visible. Very alarming, I'd say. Why, the alarmism is off the chart! How much more can we endure before the global economy is ruined? (Actually, the chart might be understating the case if we consider the escalating nature of radical alarmist rhetoric.) MORE: Via Glenn Reynolds, a link to what's best described as "Ye Olde Hockey Sticke." Plus, an upside down hockey stick from the colden days of present and future past! No seriously! MORE: This dire warning from Salon.com (in an article titled "Anti-science conservatives must be stopped") reminded me that not everyone is on the same page: If conservatives block serious action until the 2020s, then the nation and the world will begin a desperate race to avert catastrophe. By then, the world's carbon dioxide emissions and concentrations will be so high that the relatively easy market-based technology strategy will not be able to stop us from crossing the point of no return, when major amplifying feedbacks kick in and undermine all efforts to avert catastrophe. The most important feedback is probably the melting of the permafrost and tundra, which could release 1,000 billion tons of carbon -- more than the entire atmosphere contains today -- much of it in the form of methane, which is 20 times more potent at trapping heat than carbon dioxide.But what if conservatives block serious action to stop warming, and the planet cools? Who will be given credit for it? posted by Eric on 06.29.08 at 09:11 AM
Comments
I love your second graph, but am loathe to point out an issue with both graphs. It has to do with CO2. I am absolutely in your corner on this fight against hysteria of man-made global warming. The problem of the measuring of CO2 is that the reading is taken from the top of a. . . wait for it. . . volcano! Now I have written to NOAA about this and have not received any reply, even when I used my handy .gov address. If you do go to the website they say that Mona loa was decided due to it being away form industrial areas to provide a clean reading, but and active volcano? come on. They need to find another place for this, even Kuaii would be better for this. Anyway, keep up the good work. Christopher · June 30, 2008 03:51 PM This sounds like the idjit who hoped for all of these things, and then proposed that the conservative trogs should be turned back into the howling wilderness unless they were willing to become second class citizens (no vote, etc). I gently pointed out that those migrations tended to be much more like Mongols than Eloi, and that if you have bullets you can get beans. SDN · July 2, 2008 07:49 AM The Salon article is by Joseph Romm. Joseph Romm is also known for stating the amoutn of subsidies associated with nuclear power in terms of the total amount since the technology was invented and stating wind-power subsidies in terms of cost per day per household. In Joseph Romm's world, people are unable to divide. Joseph Hertzlinger · July 3, 2008 12:43 AM G.R.L. Cowan, H2 energy fan 'til ~1996 · July 4, 2008 12:20 PM Post a comment
You may use basic HTML for formatting.
|
|
July 2008
WORLD-WIDE CALENDAR
Search the Site
E-mail
Classics To Go
Archives
July 2008
June 2008 May 2008 April 2008 March 2008 February 2008 January 2008 December 2007 November 2007 October 2007 September 2007 August 2007 July 2007 June 2007 May 2007 April 2007 March 2007 February 2007 January 2007 December 2006 November 2006 October 2006 September 2006 August 2006 July 2006 June 2006 May 2006 April 2006 March 2006 February 2006 January 2006 December 2005 November 2005 October 2005 September 2005 August 2005 July 2005 June 2005 May 2005 April 2005 March 2005 February 2005 January 2005 December 2004 November 2004 October 2004 September 2004 August 2004 July 2004 June 2004 May 2004 April 2004 March 2004 February 2004 January 2004 December 2003 November 2003 October 2003 September 2003 August 2003 July 2003 June 2003 May 2003 May 2002 AB 1634 MBAPBSALLAMERICANGOP See more archives here Old (Blogspot) archives
Recent Entries
• To bed without fireworks, you bad bad country!
• Who are they? Part III • I'm sure this won't be my first disappointment.... • The gun nuts next door.... • Doggies for demolition truth • Worthless Dotcomradery • sacred grounds and sacrilegious objections • Local News • Culture War is Religious War, claims Buchanan • Gone are the days when my heart was young and...
Links
Site Credits
|
|

Excellent work! I salute you.