

|
|
|
|
October 10, 2009
Scary Saturday Graph
That's the biggest fall in employment ever. The good news is, once the trend bottoms out history suggests employment should bounce back strongly. The bad news is no one really knows when it will bottom out. And with the huge expansion of FHA, continued loss of employment could mean another massive financial crisis looming... posted by Dave on 10.10.09 at 01:44 PM
Comments
In absolute terms, this fall is actually the biggest ever, and it's the biggest percentage fall ever recorded in the EM ratio. The Depression and some of the Panics of the 1800s were almost certainly worse in percentage terms, but of course there's no EM ratio for those times. TallDave · October 10, 2009 10:18 PM I do agree with your overall sentiment, though: Difficulty is relative; overall we�re still in a period of unprecedented prosperity. The current nightmare EM ratio is about average for the 1980s, and better than the 70s, 60s, 50s, or 40s. Probably the most under-heralded statistic in economics is this: the median income of the 1950s is now roughly the poverty line (yes, that�s adjusted for inflation). Things may get a lot worse. They�ve certainly gotten bad faster and farther than ever before, at least in terms of the EM ratio. But we sit atop a mountain of cumulative productivity improvements, so they�ll have to get a lot worse before they justify some of the hyperbole being thrown around. TallDave · October 10, 2009 10:22 PM Post a comment
You may use basic HTML for formatting.
|
|
October 2009
WORLD-WIDE CALENDAR
Search the Site
E-mail
Classics To Go
Archives
October 2009
September 2009 August 2009 July 2009 June 2009 May 2009 April 2009 March 2009 February 2009 January 2009 December 2008 November 2008 October 2008 September 2008 August 2008 July 2008 June 2008 May 2008 April 2008 March 2008 February 2008 January 2008 December 2007 November 2007 October 2007 September 2007 August 2007 July 2007 June 2007 May 2007 April 2007 March 2007 February 2007 January 2007 December 2006 November 2006 October 2006 September 2006 August 2006 July 2006 June 2006 May 2006 April 2006 March 2006 February 2006 January 2006 December 2005 November 2005 October 2005 September 2005 August 2005 July 2005 June 2005 May 2005 April 2005 March 2005 February 2005 January 2005 December 2004 November 2004 October 2004 September 2004 August 2004 July 2004 June 2004 May 2004 April 2004 March 2004 February 2004 January 2004 December 2003 November 2003 October 2003 September 2003 August 2003 July 2003 June 2003 May 2003 May 2002 AB 1634 MBAPBSAAGOP Skepticism See more archives here Old (Blogspot) archives
Recent Entries
• The difference between art and music
• Nobel Prize Slap At Obama • *** Media Threat Level Raised *** • The winningest of all intentions • An Epiphany On The Left? • none dare call it corporatism • Something Is Missing • Scary Saturday Graph • There's no saving this planet without a savior! • Why we are all worse than Roman Polanski
Links
Site Credits
|
|
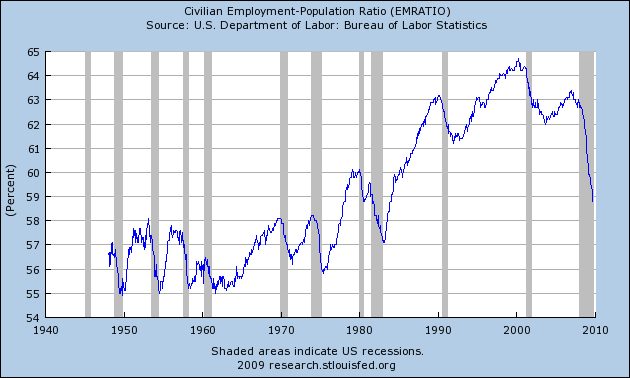
In the first place this graph doesn't include the great depression so I doubt it is the worst drop ever. Likewise, it is cut off at 54%. Basically, this thing is slanted to emphasize the current drop in employment. Let me add I am not trying to be a cheer leader for the economy. The increase in the money supply and the employment problems are extremely troubling. We just need to avoid resorting to propaganda.